
When will a home
battery pay back?
Buy electricity in the cheaper hours. Use it when the rate goes up. See what that could save in your home.
Your result
Estimated payback
Savings over 15 years
Inside the calculation
A day with your battery
Move through the day to see when your home buys electricity and when the battery takes over.
—
The working
What’s behind
your savings?
Your first year in figures
- Electricity cost without a battery
- —
- Electricity cost with a battery
- —
- Off-peak energy bought to charge
- —
- Battery energy delivered to your home
- —
- Energy lost in conversion
- —
- Additional standby electricity
- —
- Equivalent cycles of available capacity
- —
Both costs use your selected tariff. The standing charge cancels out. Overnight household use already on the cheap rate earns no battery saving.
Which figures come from MCS?
MCS 032:2025 section 4.3 gives a reporting calculation for battery uses such as tariff shifting. It multiplies usable capacity by 730, equivalent to two full cycles every day.
The payback estimate uses your charging hours and household demand. It is an Eva’s Energy planning estimate. An installer prepares the formal MCS performance report for your design.
Read MCS 032, section 4.3 (PDF)Where do the battery specifications come from?
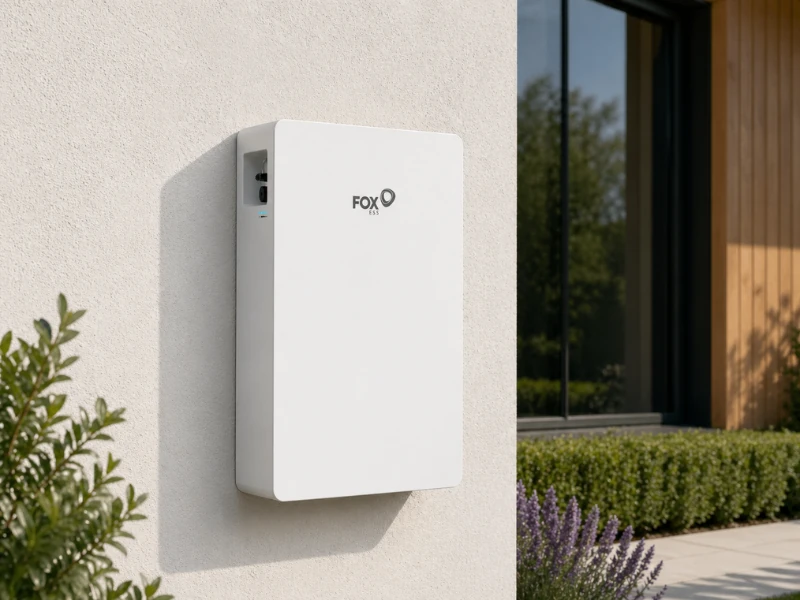
The Fox ESS EVO 10-5-H has 10.24 kWh nominal capacity, 95% depth of discharge and 5 kW rated AC output. That gives 9.73 kWh usable inside the battery before any extra backup reserve or conversion losses.
The Fox example starts with an assumed grid charge limit of 5 kW and 90% whole-system AC round-trip efficiency. The UK datasheet gives inverter efficiency separately. The 90% is an editable modelling assumption for the EVO. For context, Tesla publishes 90% AC round-trip efficiency for its Powerwall 2 under specified test conditions.
The generic sizes, reserve, degradation and standby settings are illustrative. Use figures for the equipment and settings in your own quote.
Fox ESS UK EVO datasheet (PDF)Tesla UK AC efficiency reference (PDF)
How are usage and payback calculated?
Your annual use is spread over 365 identical days. An illustrative half-hour profile puts more demand in the morning and evening. If you enter your off-peak share from your bill, the profile is adjusted to match it. Seasonal heating, short power spikes and variable smart-tariff slots can give different results.
Each half-hour is limited by available storage, charging power and discharge power. The model splits conversion losses equally between charging and discharging. The grid covers any unmet demand. The battery skips charging if the price difference cannot cover conversion losses.
Payback is when cumulative bill savings cover your installed price. Capacity declines each year by the percentage you enter. Prices and household use stay constant. The 15-year illustration assumes continued operation and excludes solar generation, exports, finance, repairs, replacements and discounting. A battery warranty may cover a shorter period.